Double Slit Experiment Visualization
An interactive p5.js + WebGL visualization of the famous double slit experiment, letting you play with wavelength, slit distance and screen distance in real time.
p5.js WebGL physics
Built with: p5.js · WebGL · JavaScript
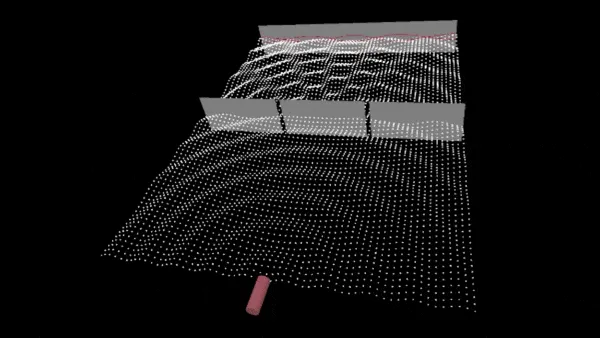
The double slit experiment is one of the most beautiful demonstrations in physics — it shows light behaving as a wave and a particle at the same time. I built this interactive visualization to make the interference pattern tangible: drag the sliders and watch the fringes respond instantly.
What it does
- Simulates the interference pattern produced by two coherent light sources
- Lets you change the wavelength, slit separation, and screen distance in real time
- Renders the intensity distribution with WebGL so it stays smooth even at high resolutions
How it works
The intensity at any point on the screen follows from the path difference between the two slits. The core of the simulation boils down to a few lines:
const pathDifference = (d * x) / L;
const phase = (2 * Math.PI * pathDifference) / wavelength;
const intensity = Math.pow(Math.cos(phase / 2), 2);
Everything else is rendering — and that’s where p5.js with the WebGL renderer shines.